 Distortion Analyzer Hewlett Packard 332A matr. N° 930 – 96620. Seconda parte.
Nell’inventario particolare del Laboratorio di Elettronica al n° D 4826, in data ottobre 1970, si legge: “Distortion Analyzer S/N 620 mod. 332A”.
Nell’HEWLETT·PACKARD Journal VOL. 17 NO. 8 APRIL 1966 vi è addirittura la presentazione del modello 334A che nell’amplificatore di eliminazione della tensione a frequenza fondamentale (rejection) ha il ponte di Wien, come questo mod. 332A e come l’esemplare -hp- 330B che si può vedere in questo sito nella sezione Radiotecnica.
Le figure che seguono sono state tratte dal manuale di istruzioni OPERATING AND SERVICE MANUAL DISTORTION ANALYZER 331A/332A HEWLETT hp PACKARD Printed JUNE 1969, conservato presso la Sezione Elettronica. Per vedere le altre tre parti scrivere “332A” su Cerca.
Istruzioni quasi identiche si possono trovare ad esempio all’indirizzo: https://www.artisantg.com/info/ATGx6v9r.pdf
§§§ «SECTION III
OPERATING INSTRUCTIONS
3-1. INTRODUCTION.
3-2. The Models 331A and 332A Distortion Analyzers measure total harmonic distortion of fundamental frequencies from 5 Hz to 600 kHz; harmonics up to 3 MHz are included. The sharp elimination characteristics (>80 dB), the low level of instrument induced distortion, and the meter accuracy of these instruments result in highly accurate measurement of low level harmonic distortion.
3-3. An rms calibrated voltmeter is inherent in the 331A and 332A. The voltmeter provides a full scale sensitivity of 300 μvolts rms (residual noise <25 μvolts). The voltmeter frequency range is from 5 Hz to 3 MHz except on the 0.0003 volt range, which is from 20 Hz to 500 kHz.
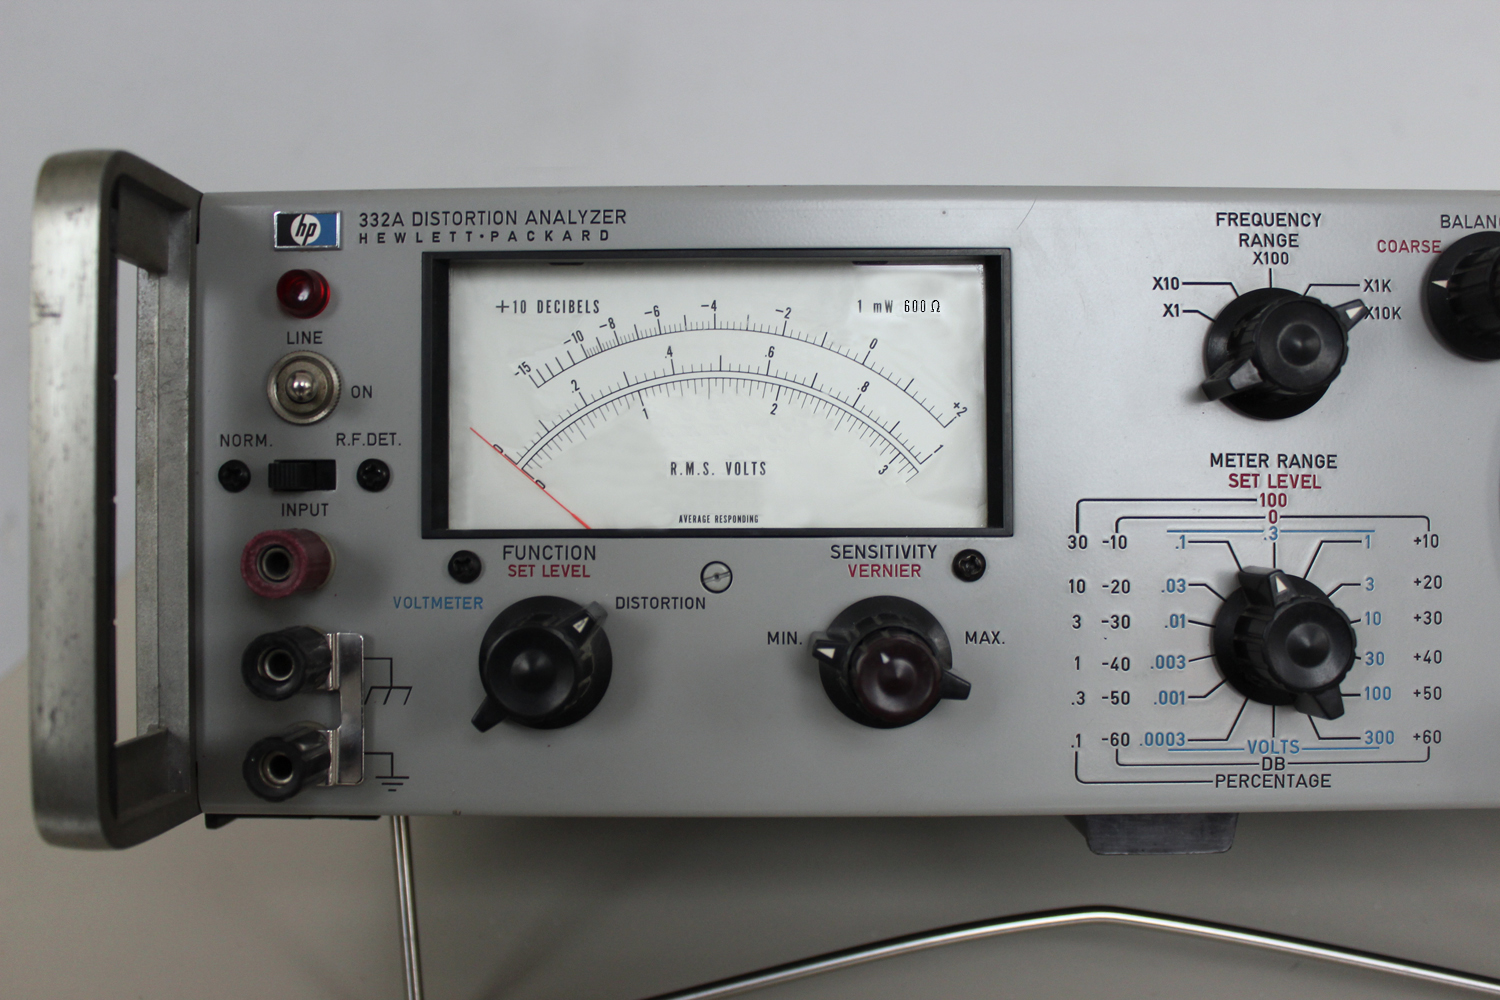
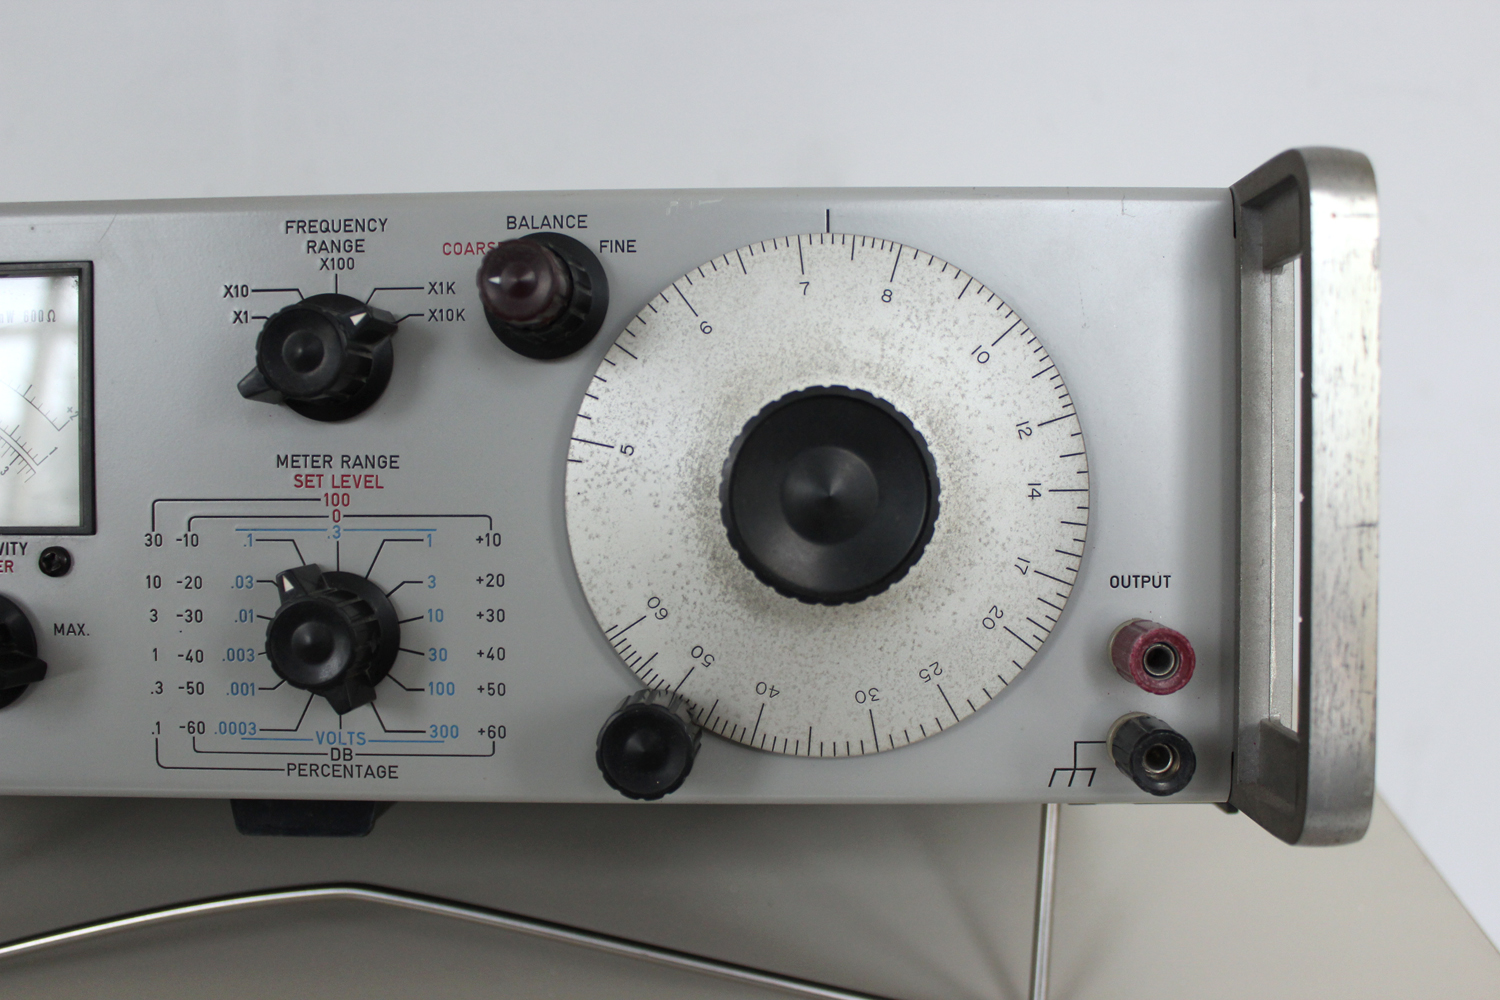
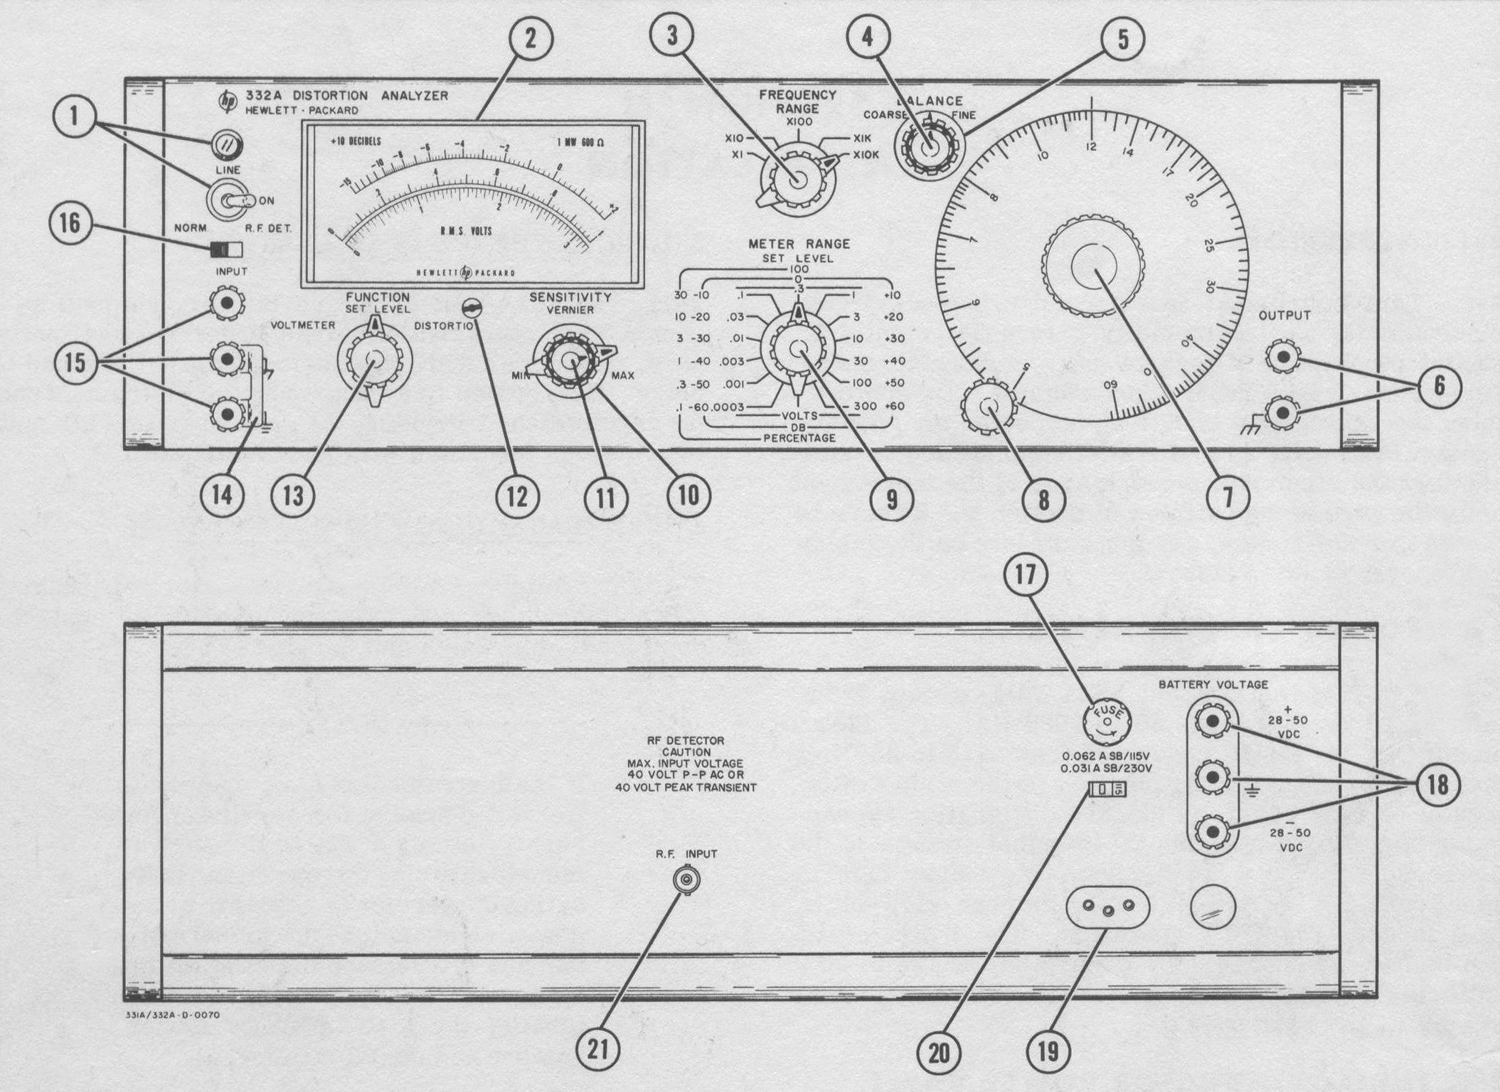
3-4. CONTROLS AND INDICATORS.
3-5. Figure 3-1 illustrates and describes the function of all front and rear panel controls, connectors, and indicators. The description of each component is keyed to the drawing included within the figure.
3-6. GENERAL OPERATING INFORMATION.
3-7. INPUT CONNECTIONS.
3-8. A signal source can be connected to the 331A and 332A through twisted pair leads or a shielded cable with banana plug connectors. Keep all test leads as short as possible to avoid extraneous pickup from stray ac fields. When measuring low-level signals, avoid ground loop currents by connecting only the 331A or 332A Distortion Analyzer directly to power-line ground through a NEMA (three-prong) connector. Connect all other instruments to the power source through a three-prong to two—prong adapter and leave the pigtail disconnected. Both the 331A and 332A have a dc isolation of ±400 Vdc from the external chassis. WARNING
WHEN THE INSTRUMENT IS OPERATED IN A FLOATING CONDITION, THE SET SCREWS IN THE CONTROL KNOBS WILL BE AT THE FLOATED POTENTIAL. TO PROTECT OPERATING PERSONNEL, ENSURE THAT THE SET SCREW HOLES ARE- FILLED WITH AN INSULATING MATERIAL SUCH AS E. SILICON RUBBER , RTV-108. (-hp- PART NO. 0470-0304) .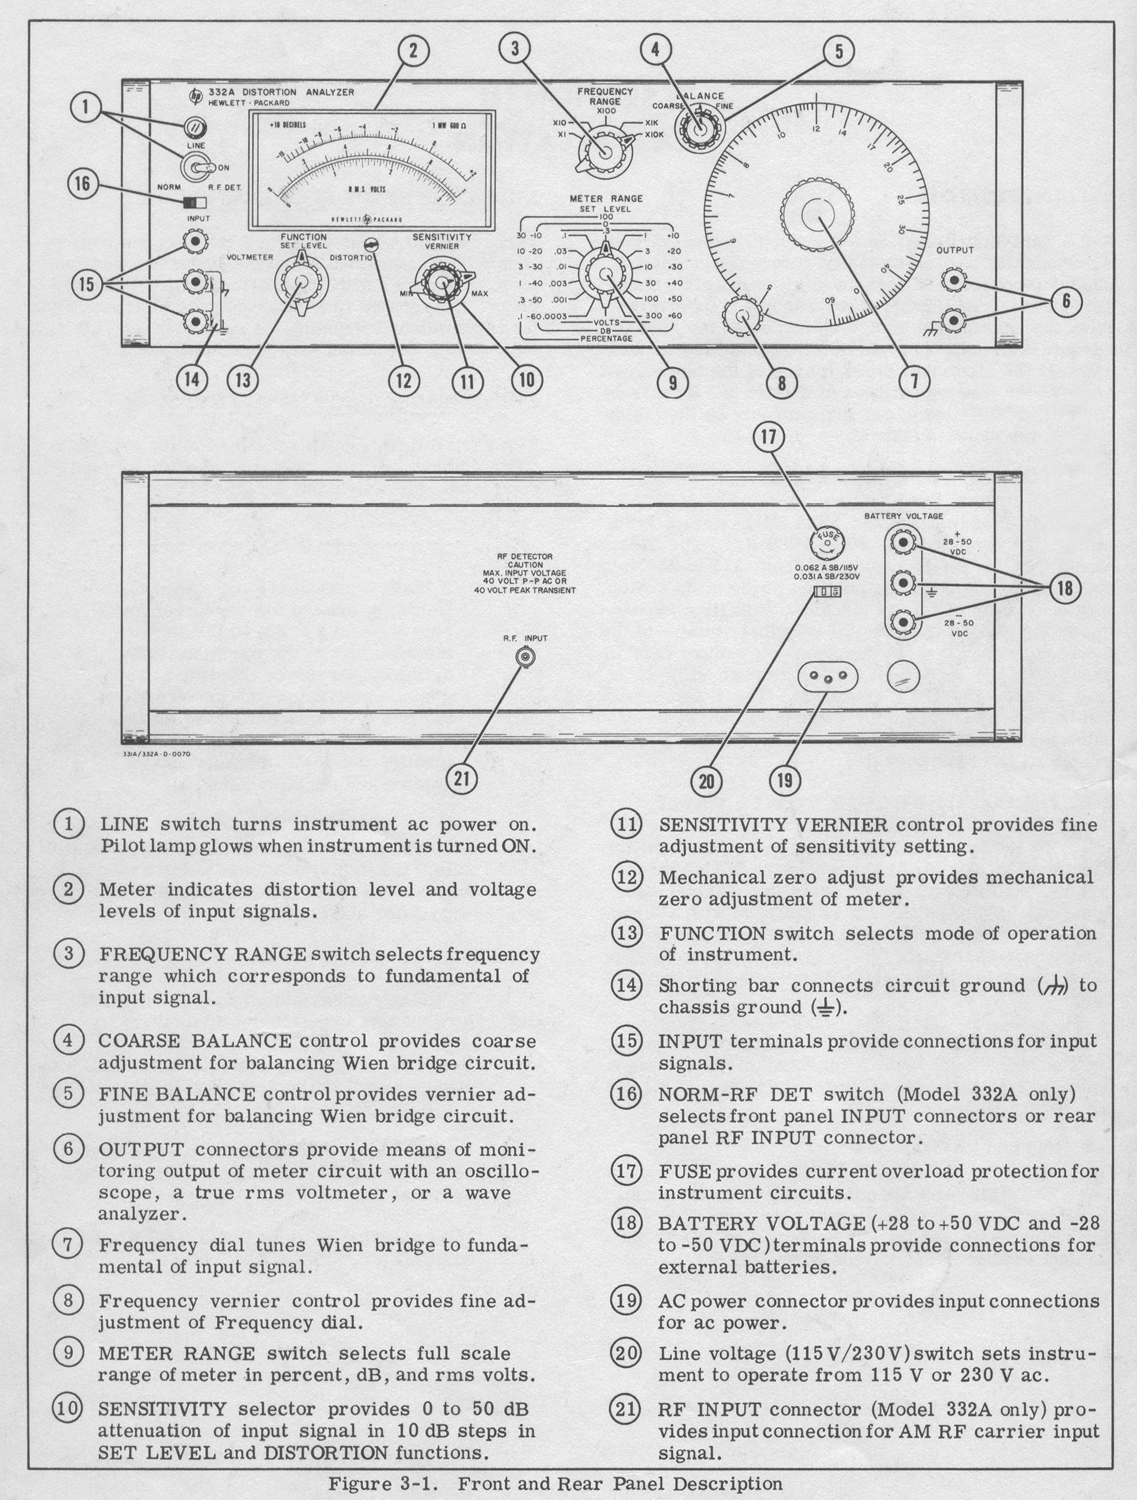 3-9. VOLTMETER CHARACTERISTICS.
3-10. The RMS VOLTS markings on the meter face
are based on-the ratio between the average and effective (rms) values of a pure sine wave. The ratio of average to effective values in a true sine wave is approximately 0.9 to 1. When the meter is used to measure complex waves, the voltage indicated may not be the rms value of the signal applied. This deviation of meter indication exists because the ratios of average to effective values are usually not the same in a complex wave as in a sine wave. The amount of deviation depends on the magnitude and phase relation between the harmonics and fundamental frequency of the signal applied. Table 3-1 shows the deviation of the meter indication of a sine wave partly distorted by harmonics. As indicated in the table, harmonic content of less than approximately 10% results in very small errors.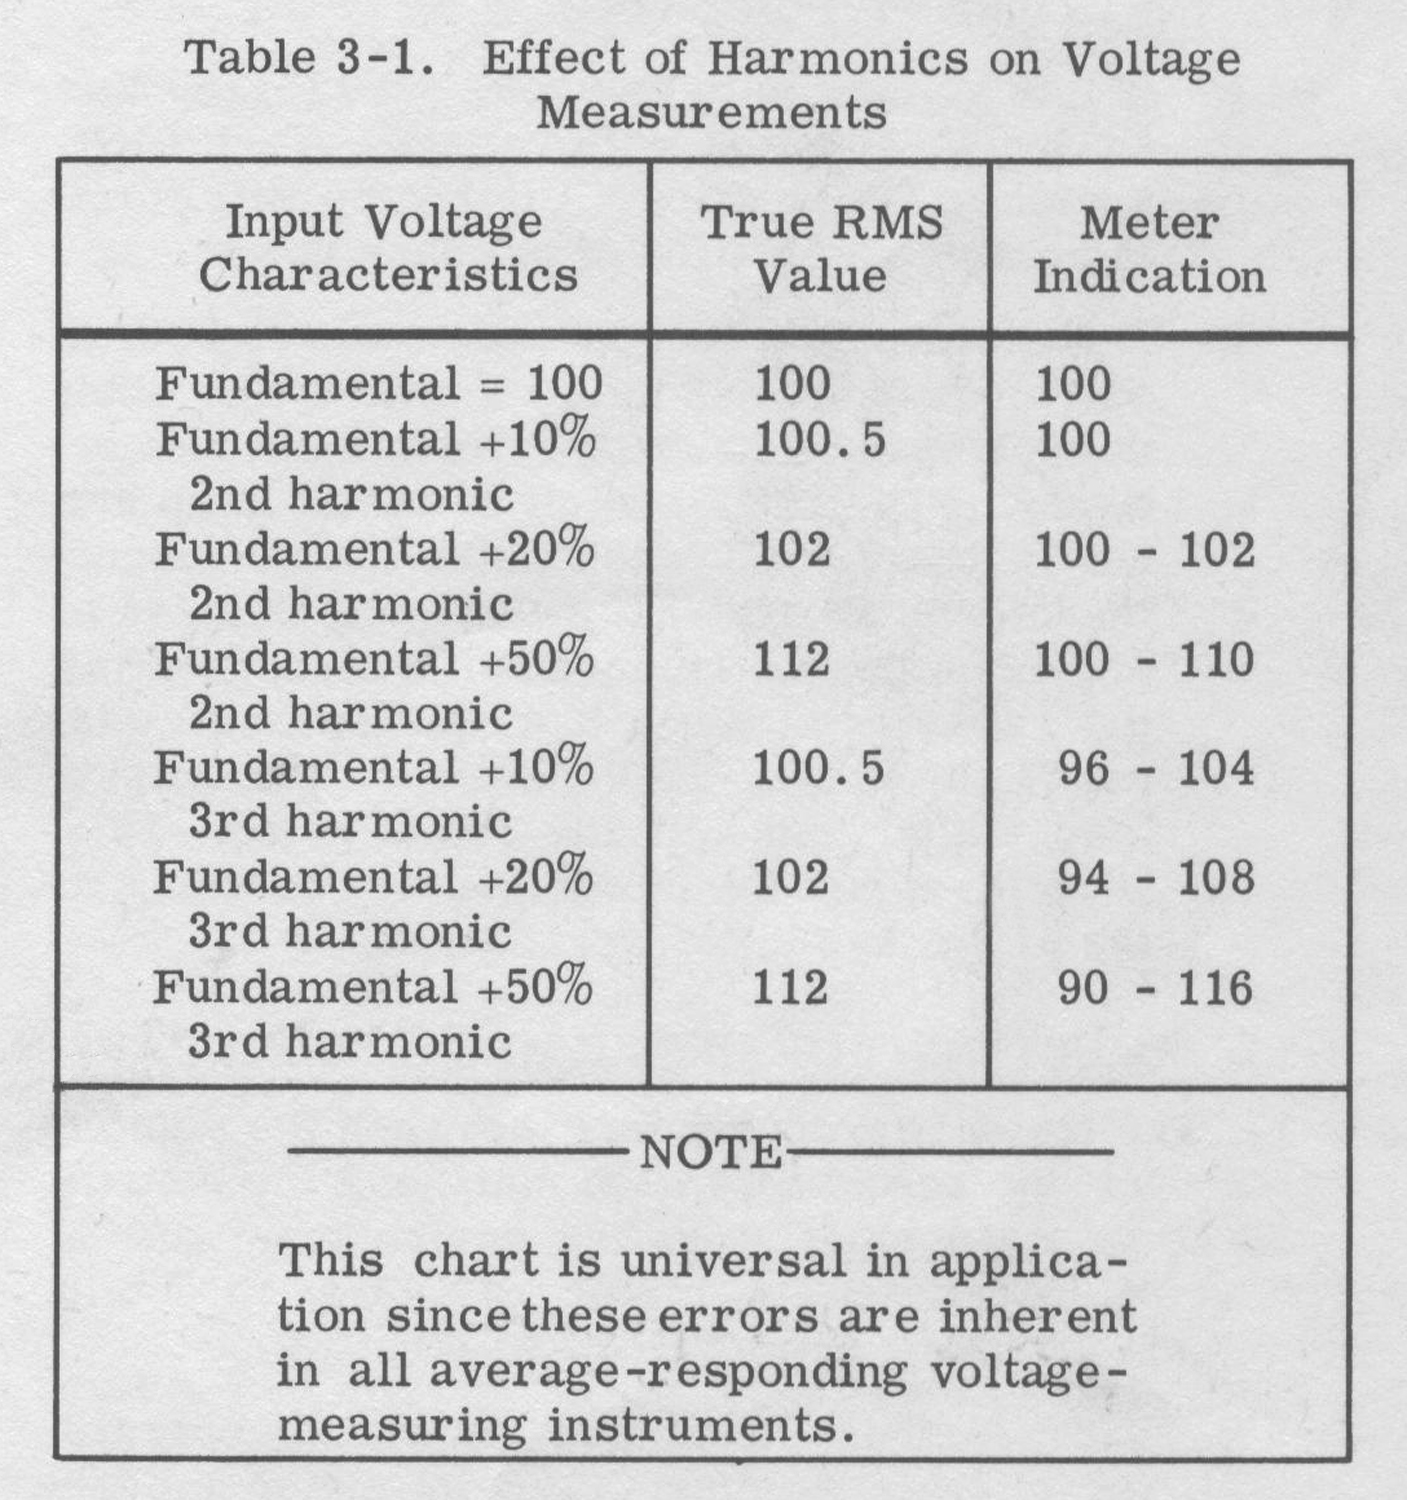 3-11. In distortion measurements where the fundamental frequency is suppressed and the remainder of the signal is measured, the reading obtained on an average-responding meter may deviate from the true total rms value. When the residual wave contains many in harmonically related sinusoids, the maximum error in the distortion reading is about 11% low for distortion levels below 10%.
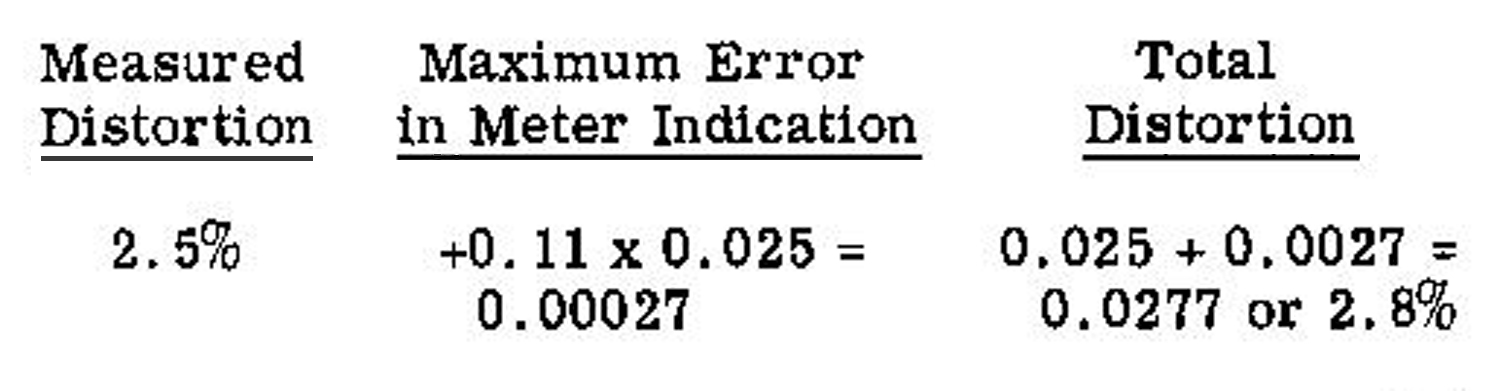 This example represents the maximum possible error, and in most cases the error is less. In distortion measurements, the reading of an average-responding meter is sufficiently close to the rms value to be satisfactory for most applications.
3-12. OUTPUT CHARACTERISTICS.
3-13. The OUTPUT terminals provide a 0.1 V rms open circuit output for full scale meter deflection. These terminals can be used to monitor the output signal with an oscilloscope, a true rms voltmeter, or a wave analyzer. The combinations of the distortion meter and oscilloscope provides more significant information about the device under test than the expression of distortion magnitude alone. Information obtained from the oscilloscope pattern is specific and reveals the nature of the distortion that sometimes occurs at such low levels that it is difficult to detect in the presence of hum and noise. The impedance at the OUTPUT terminals is 2000 ohms; therefore, capacitive loads greater than 50 pF should be avoided to maintain the accuracy of meter readings.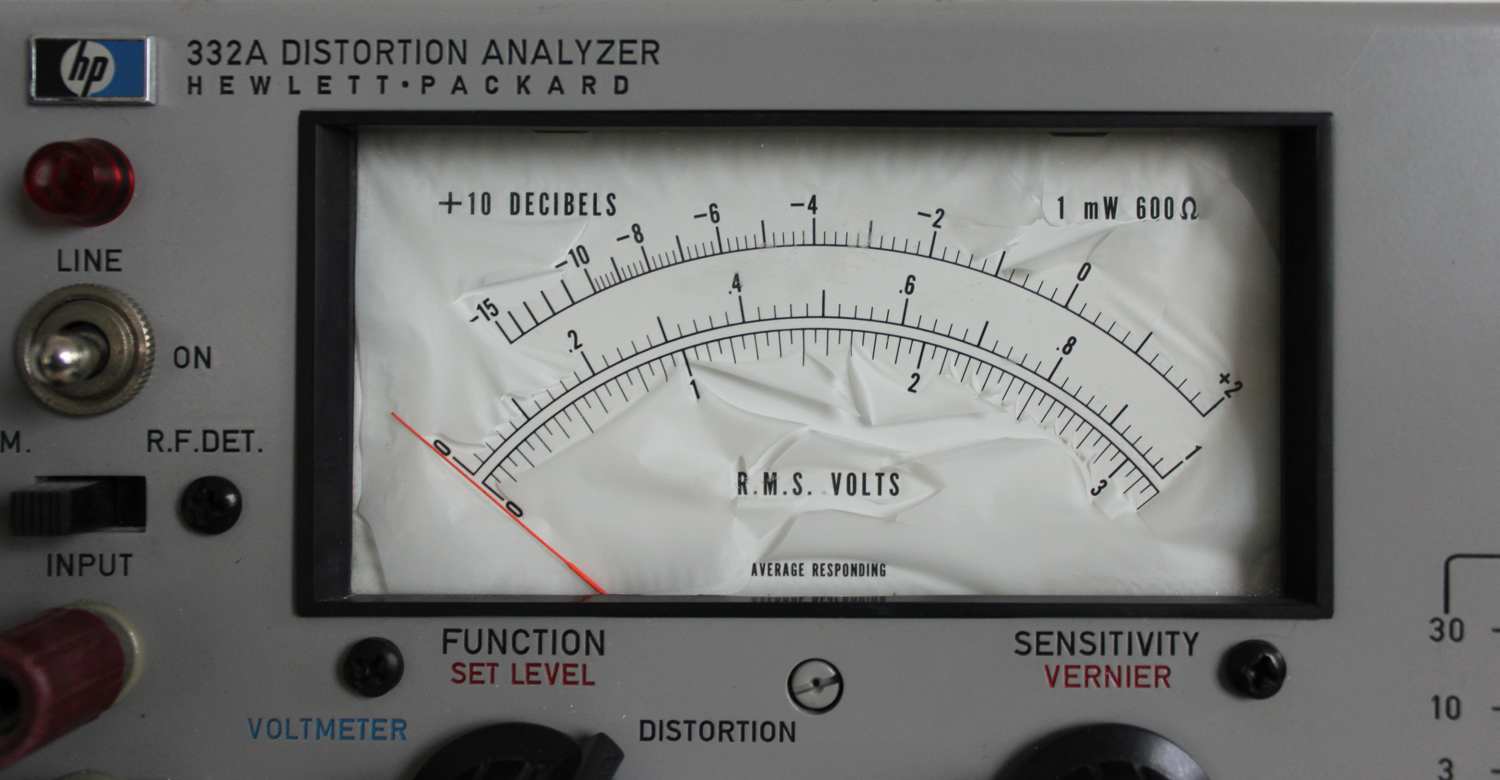
3-14. OPERATING PROCEDURES.
3-15. INSTRUMENT TURN-ON.
1. If line voltage is Ito be used, set 115-230 Vac switch to coincide with voltage. Turn LINE switch to ON position. Pilot lamp will glow, indicating application of primary power.
2. If batteries are to be used, connect both a +28 to +50 V and -28 to -50 V battery (or other dc source) to + and – battery terminals , respectively. (The LINE switch and pilot lamp are not in the circuit when batteries are used; therefore, an external switch may be used to provide a convenient means for disconnecting the batteries). When a dc power source is used, check the -25 V power supply output (any violet lead). If the output is not -25 V ±0. 5 V, adjust the power supply according to the procedure in Paragraph 5-24.
3-16. ADJUSTMENT OF METER MECHANICAL ZERO.3-17. The meter is properly zero-set when the pointer rests over the zero calibration mark and the instrument is in its normal operating environment and is turned off. Zero-set the meter as follows to obtain maximum accuracy and mechanical stability:
1. Turn instrument on and allow it to operate for at least 20 minutes, to let meter movement reach normal operating temperature.
2.Turn instrument off and allow 30 seconds for all capacitors to discharge.
3. Rotate zero adjustment screw clockwise until pointer is left of zero and moving upscale,
4. Continue rotating screw clockwise; stop when pointer is exactly at zero.
5. When pointer is exactly over zero, rotate adjustment screw slightly counterclockwise to relieve tension on pointer suspension. If pointer moves off zero, repeat steps c through e, but make counterclockwise rotation less.
3-18. DISTORTION MEASUREMENT.
CAUTION
DO NOT EXCEED THE INPUT VOLTAGES LISTED BELOW TO PREVENT BLOWING FUSE F2:
(See Table 5-8 for symptoms of blown-fuse.)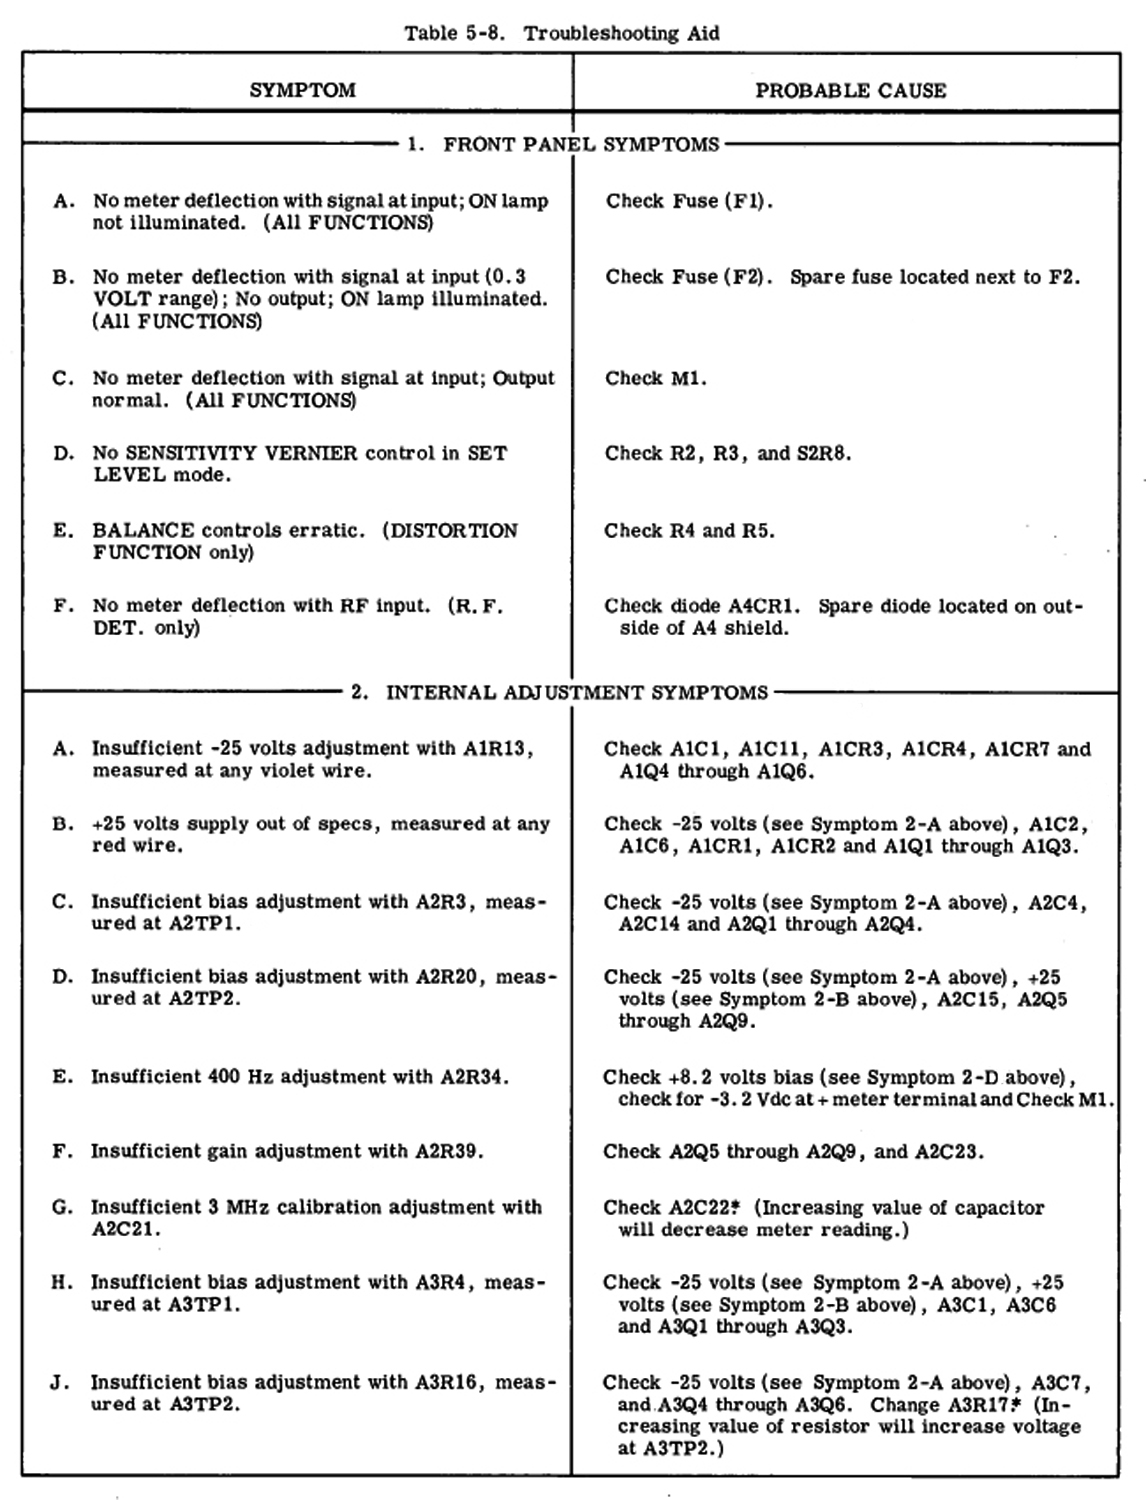 VOLTMETER FUNCTION -1 V RANGE AND BELOW, AND DISTORTION ANALYZER FUNCTION-MAXIMUM SENSITIVITY.
1. 300 V ABOVE 100 Hz
2. 50 V ABOVE 1 KHZ IF LOW FREQUENCIES ARE NOT TO BE MEASURED, C1 MAY BE REPLACED WITH A SMALLER CAPACITOR, AND THE VOLTAGE LIMITS OF F2 MAY BE RAISED ACCORDINGLY.
a.Turn instrument on and mechanically zero meter according to procedure in Paragraphs 3-15 and 3-16.
b. Set NORM-R.F. DET. Switch to NORM.
c. Set FUNCTION switch to SET LEVEL.
d. Set SENSITIVITY selector to MIN. position, and rotate VERNIER control maximum counterclockwise.
NOTE
The bandwidth of the SENSITIVITY selector is reduced in the two extreme counterclockwise positions (positions used with an input signal greater than 30 V).
e. Set METER RANGE switch to SET LEVEL, and set BALANCE COARSE and FINE controls to center position.
f. Connect signal to be measured to 331A/332A INPUT terminals.
WARNING
REMOVE SHORTING STRAP BETWEEN CIRCUIT GROUND
AND CHASSIS GROUND (See GENERAL SCHEMATIC NOTES)
TERMINALS ON FRONT PANEL INPUT TERMINAL WHEN MEASURING DISTORTION BETWEEN TWO POINTS WHICH ARE DC OFFSET FROM GROUND POTENTIAL.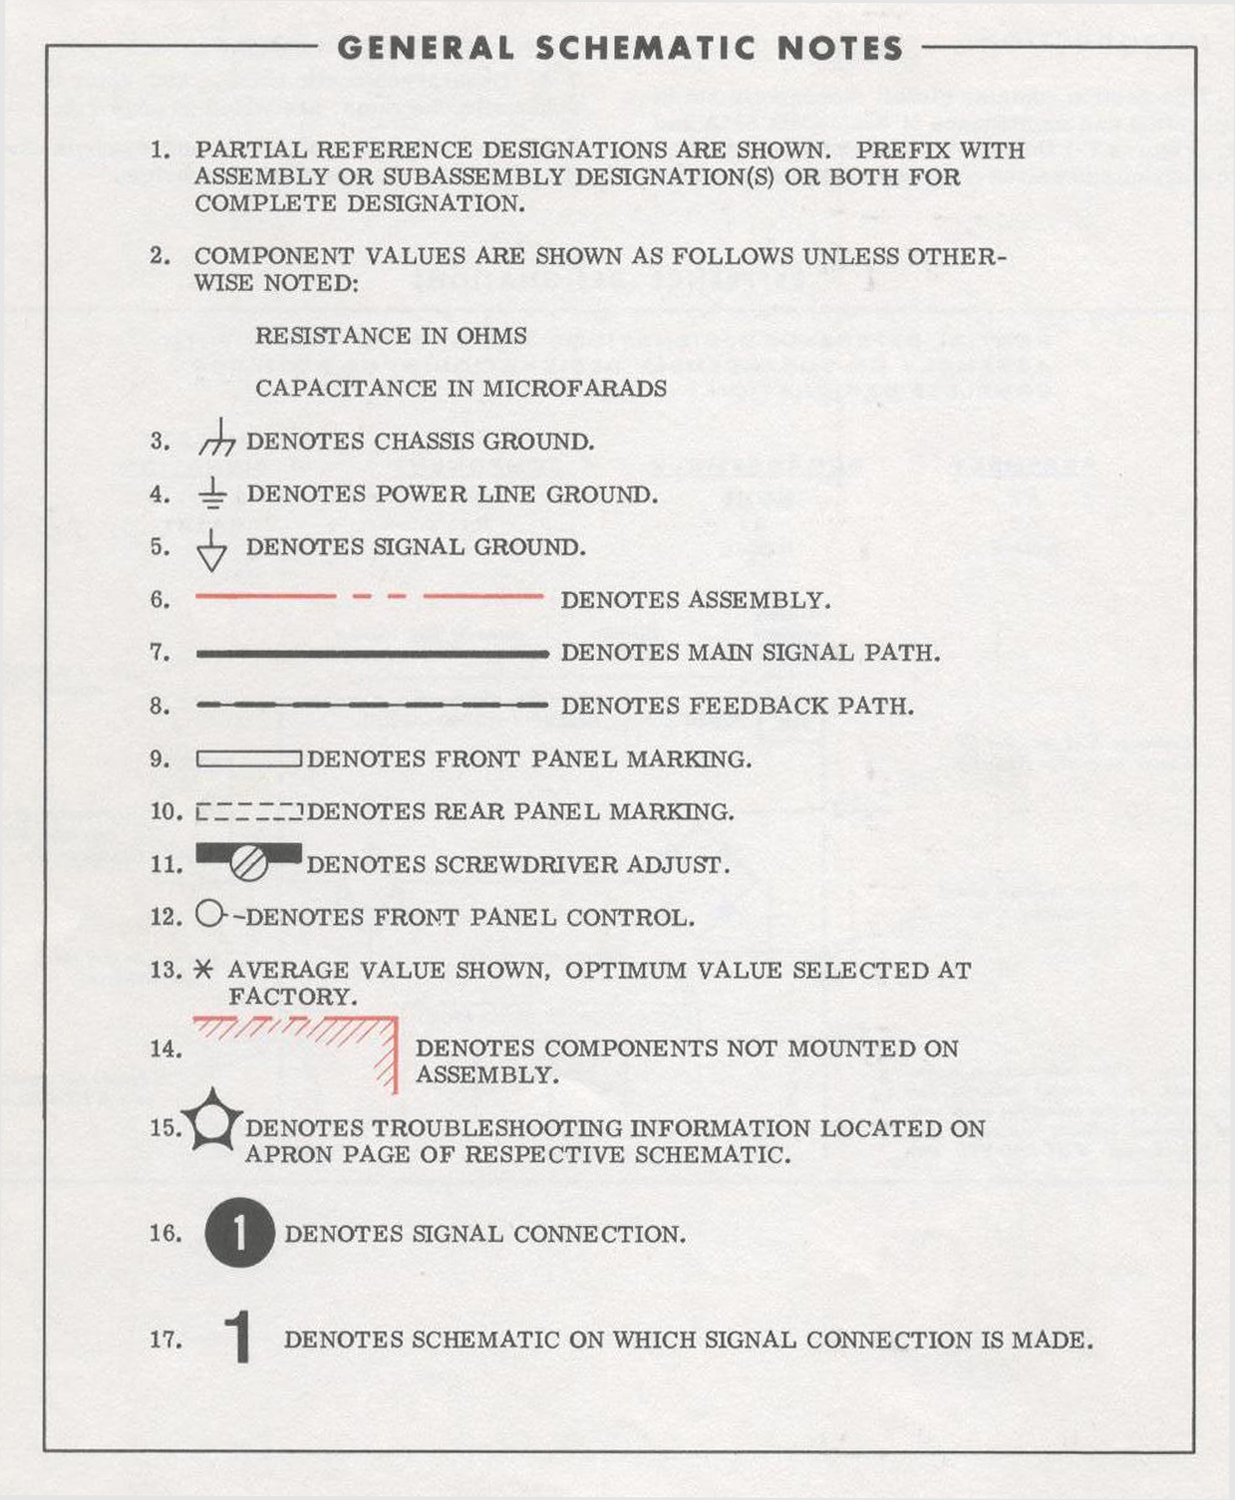 g. Set SENSITIVITY selector to obtain meter indication greater than 1/3 full scale.
h. Adjust SENSITIVITY VERNIER for full scale meter indication if making distortion measurement in percent; if making distortion measurement in dB, adjust SENSITIVITY VERNIER for 0 dB meter indication.
NOTE
If unable to adjust for full scale or 0 dB indication (which indicates input signal is below 0.3 volts), set METER RANGE selector down-scale. Use this new setting as the 100% or 0 as SET LEVEL position, thus making the next range 30% or -10 dB etc.
i. Set FREQUENCY RANGE switch and frequency dial to fundamental frequency of input signal.
j. Set FUNCTION Switch to DISTORTION.
k. Adjust frequency dial vernier and BALANCE COARSE and FINE controls for minimum meter indication. Set METER RANGE switch down-scale as necessary to keep meter indication on scale.
Note
Because of the high sensitivity and narrow fundamental rejection notch, pressure applied to the top cover may cause the null to shift. This is caused by small capacitive changes between the Wien bridge and case. Accuracy of reading is not degraded, however, if the pressure is constant and the bridge is rebalanced.
l. Repeat step k until no further reduction in meter indication can be obtained.
m. Observe distortion either-in percentage or dB, as indicated by meter deflection and METER RANGE switch setting. For example, if meter indicates 0.4 and METER RANGE setting is 1%, distortion measured is 0.4% of fundamental. Similarly, if meter indicates -6 dB and METER RANGE setting is -40 dB, distortion measured is -46 dB from fundamental.
NOTE
The accuracy of distortion measurements is affected by the frequency stability of the input signal. An inaccuracy in distortion indications occurs when the frequency drift of the input signal exceeds the bandwidth of the rejection curve.
p. If desired, rms voltage of input signal can be measured by setting FUNCTION switch to VOLTMETER, and setting METER RANGE switch to obtain an on-scale indication.
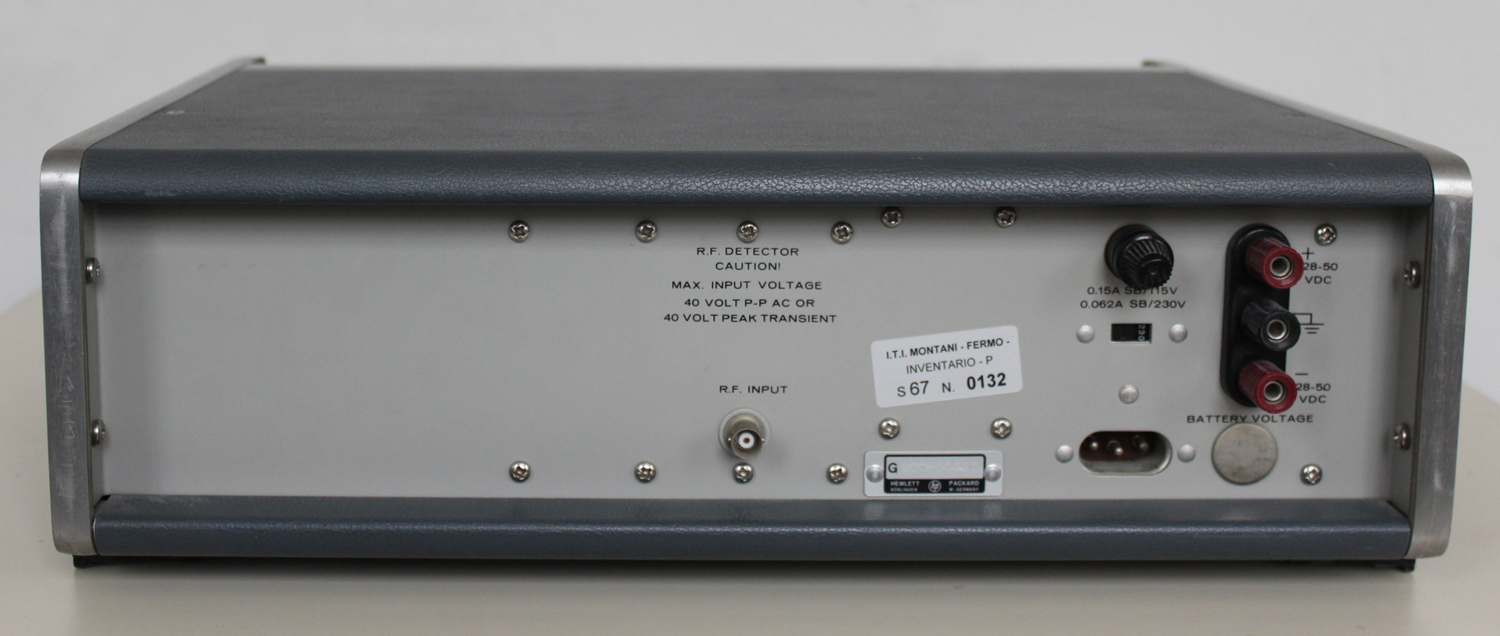
3-19 DISTORTION AND NOISE MEASUREMENT OF AM RF CARRIERS (332A ONLY).
CAUTION
DO NOT EXCEED MAXIMUM INPUT VOLTAGES LISTED ON REAR PANEL.
3-20 DISTORTION MEASUREMENT.
a. Turn instrument on and mechanically zero meter according to procedure in Paragraphs 3-15 and 3-16.
b. Set NORM. -R. F. DET. switch to R. F. DET.
c. Connect input signal to R. F. INPUT terminal on rear panel.
d. Refer to Paragraph 3-18 for distortion measurement procedures.
NOTE
If no meter deflection can be obtained with an RF input, diode, A4CR1 should be checked. A spare diode is located on the outside of the A4 shield.
3-21 NOISE MEASUREMENT.
a. Perform steps a through c of Paragraph 3-20.
b. Set modulation of carrier to 100%, using amodulating frequency between 20 Hz and 20 kHz.
c. Set FUNCTION switch to SET LEVEL, and set METER RANGE to SET LEVEL.
d. Adjust SENSITIVITY controls for 0 dB indication on meter.
e. Reduce modulation of carrier to 0%.
f. Leave FUNCTION switch in SET LEVEL position, and adjust METER RANGE switch for on-scale meter indication.
g. Noise level of carrier is algebraic sum of meter reading and METER RANGE setting.
h. This same general procedure can be used to measure noise in an FM carrier when an external discriminator is substituted for the AM detector.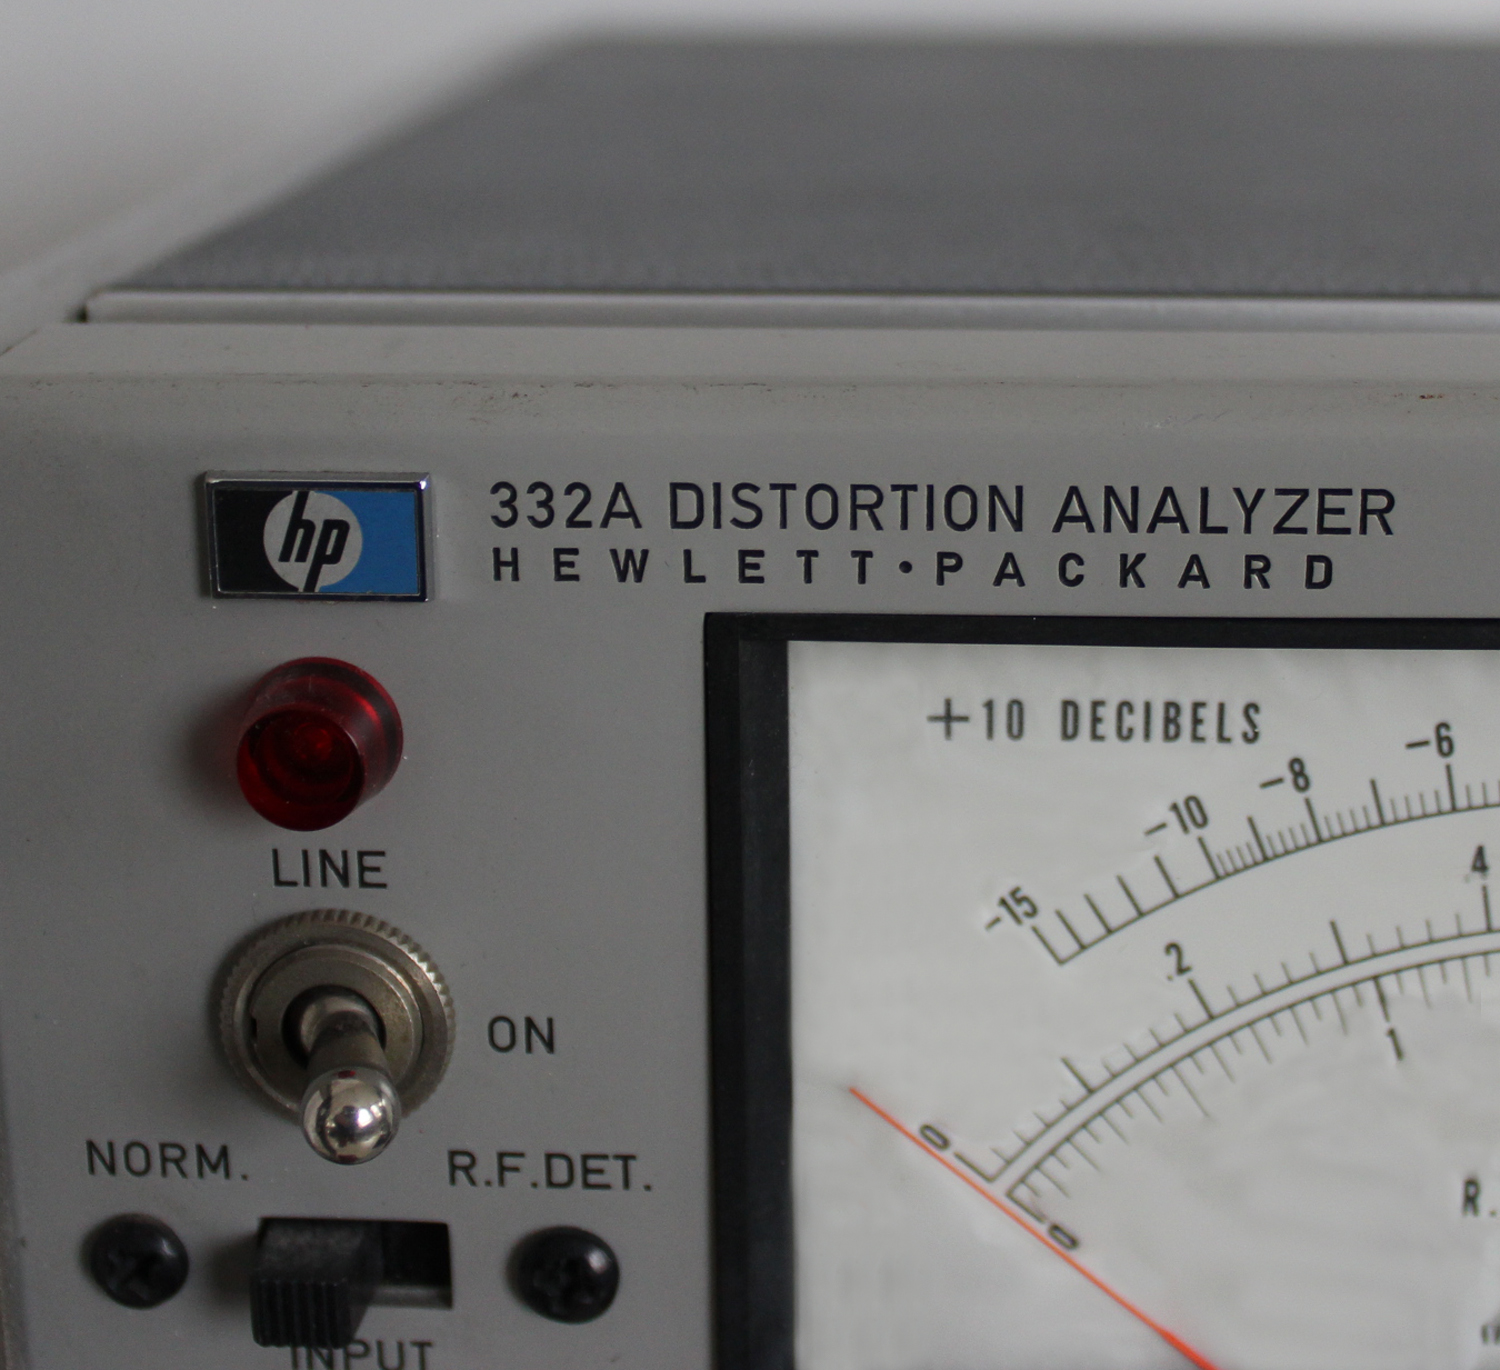 3-22 VOLTAGE MEASUREMENT.
a.Turn instrument on and mechanically zero meter according to procedure in Paragraphs 3-15 and 3-16.
b. Set NORM. -R. F. DET. switch to NORM.
c. Set FUNCTION switch to VOLTMETER.
d. Set METER RANGE switch to a range exceeding amplitude of signal to be measured.
e. Connect signal to be measured to INPUT terminals.
f. Set METER RANGE switch to give a reading as close to full scale as possible, and observe meter indication.
g. The dB scale of the 331A/332A is calibrated in dBm, such that 0 dBm = 1 milliwatt dissipated by 600 ohms. Therefore, a dBm measurement must be made across 600 ohms. However, dB measurements across other impedances can be converted to dBm by use of the Impedance Correction Graph of Figure 3-2.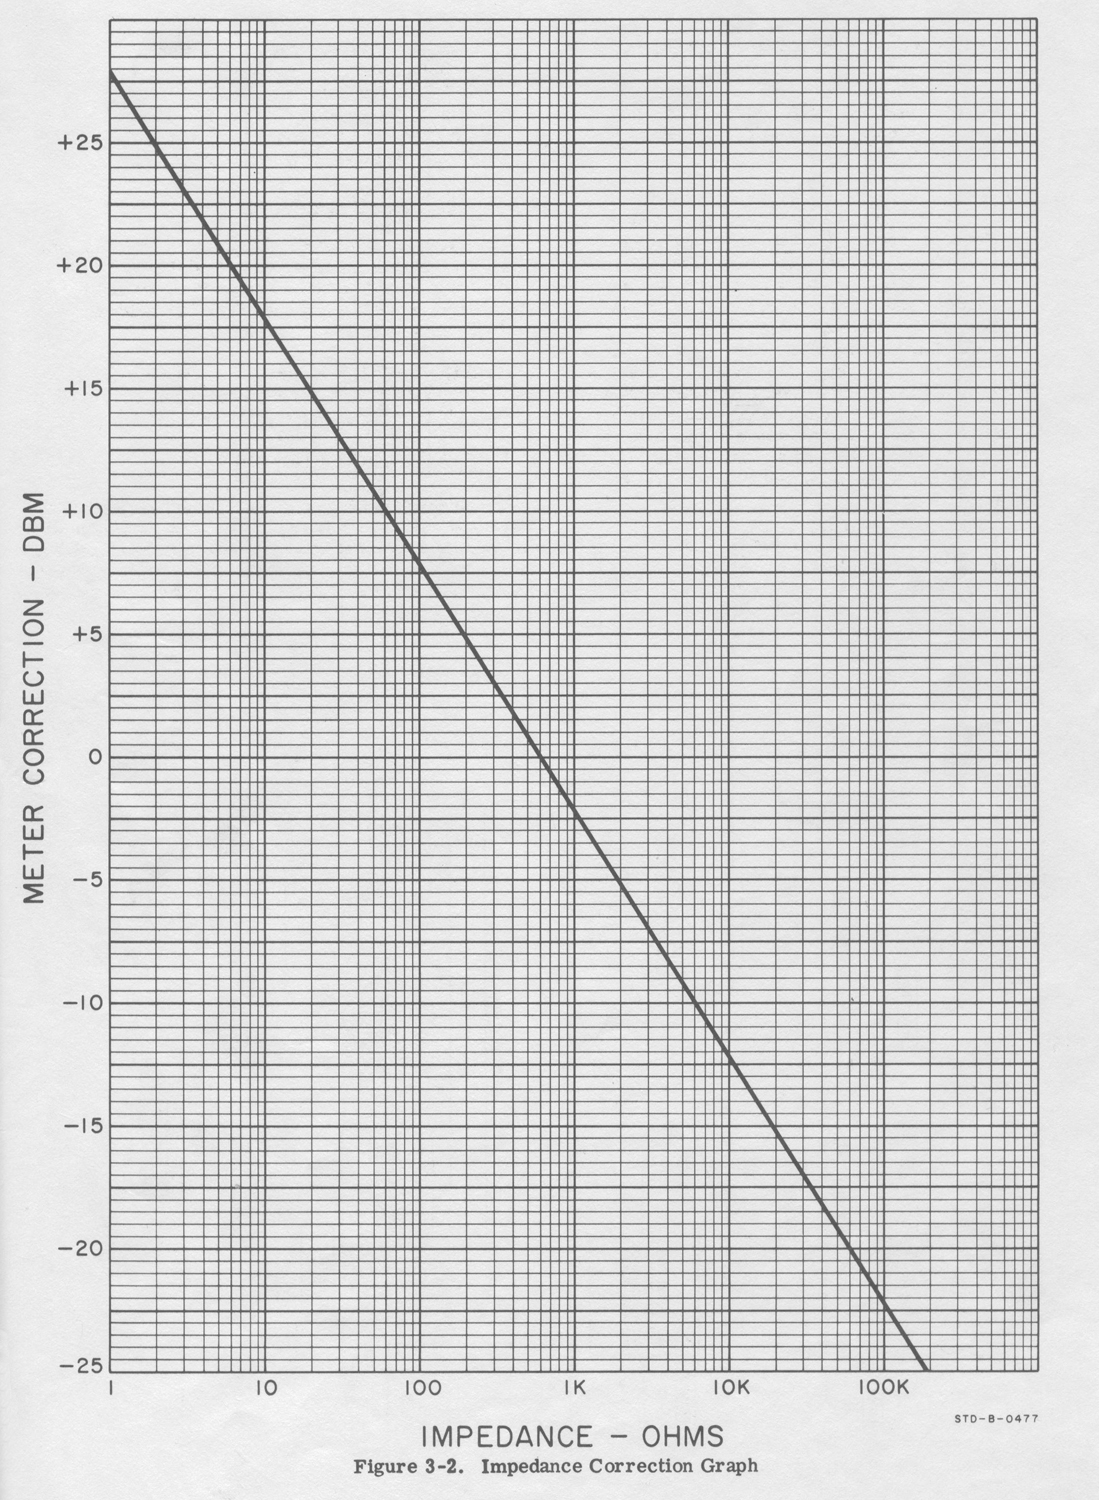 For example: To convert a -30 dB reading across 200 ohms to dBm, locate the 200 ohm impedance line at the bottom of the graph. Follow the impedance line to the heavy black line, and read the meter correction at that point. The correction for 200 ohms is +5 dBm; thus the corrected reading is -25 dBm.
NOTE
When dBm measurements are made, the dB markings on the METER RANGE switch must each be lowered by 10. That is, the dB marking for the 0.3 V range becomes -10 dBm, 1 V range becomes 0 dBm, 3 V range becomes +10 dBm etc. If the other dB markings are used, the dBm readings will be 10 dBm high. 3-23. USE OF OUTPUT TERMINALS.
3-24. In VOLTMETER and SET LEVEL functions, the
331A/332A can be used as a low distortion, wideband amplifier. A portion of the meter input (0. 1 V rms open circuit for full scale meter deflection) is provided at the OUTPUT terminals.
3-25. In DISTORTION function, the distortion (0.1 V rms open circuit for full scale deflection) is provided at the OUTPUT terminals for monitoring purposes.
3-26. 331A/332A WITH OPTION 01.
3-27. Operating procedures for the 331A/332A with
Option 01 are the same as for the standard instrument. The only difference between the standard and optional instrument is that the Option 01 has a special meter and meter amplifier which is compensated to respond to VU (volume unit) characteristics».
§§§
Per consultare le altre parti scrivere “332A” su Cerca.
Foto di Claudio Profumieri, elaborazioni e ricerche di Fabio Panfili.
Per ingrandire le immagini cliccare su di esse col tasto destro del mouse e scegliere tra le opzioni.